Dashboard shows us the month to month sales report from the marketplaces and the clicks that we received from comparison shopping engines.
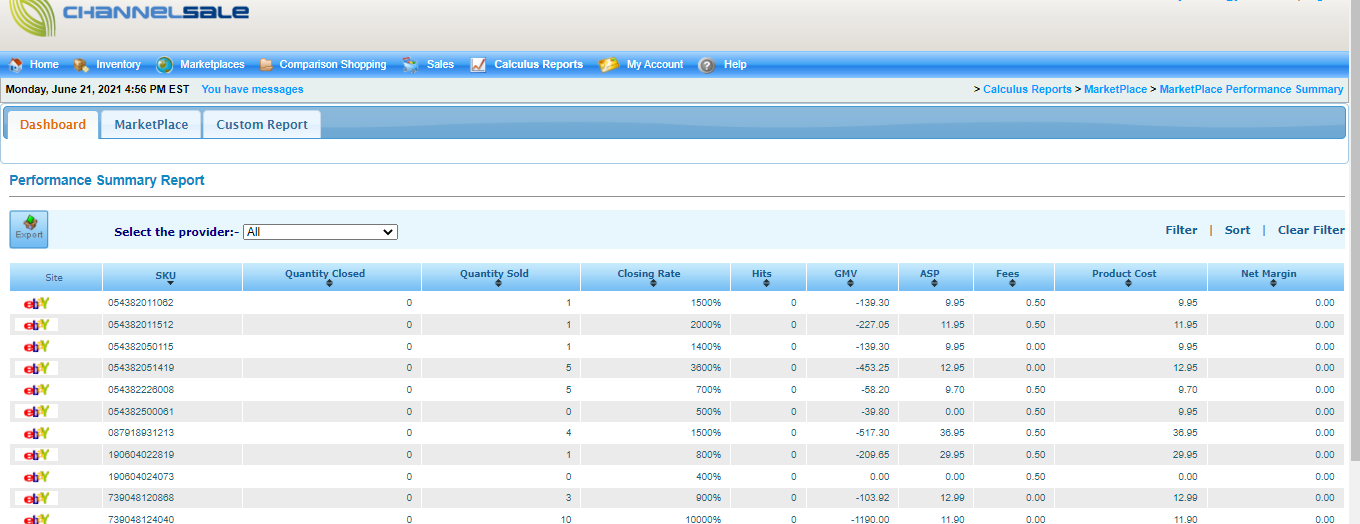
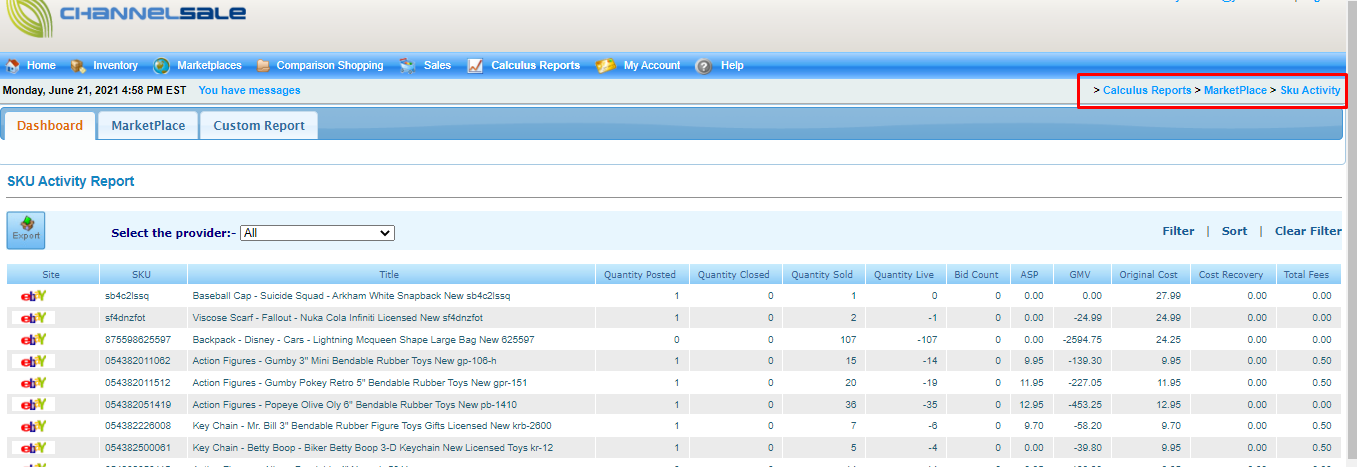
For granular level reports, we can go to Calculus Reports > Marketplaces >Inventory Velocity/Site Activity/SKU Activity/ Marketplace Performance Summary
Inventory Velocity shows the SKUs that have had sales over past 2 weeks.
Report displays SKU number, title, quantity, average sales per week, estimated weeks remaining and date created.
Bottom left hand corner will show the total number of SKUs received sales in last 2 weeks and we can adjust page size on bottom right hand corner.
Listing activity shows us the marketplace where the SKUs are listed along with other critical telemetry like the number of days the SKU has been active, quantity sold, quantity live, GMV and start price.
Go to SKU activity and we have an option to filter as per marketplace and we can see different quantities along with original cost and cost recovery.
Marketplace performance summary shows us the closing rate, product cost and net margin.
Please note the option to export reports on top left hand side.


